We provide guidance to create maps of your organizational data in SharePoint. Reveal trends and patterns by visualizing large datasets in a geographic context. Our consultants can quickly map demographic and lifestyle data to show your organization executive GIS dashboards for informed decision making ability.
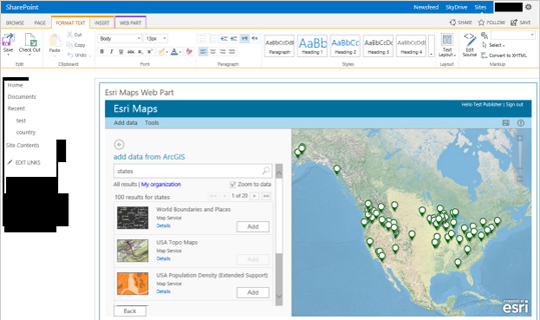
ArcGIS for SharePoint has an interactive Map Web Part.
Map Your Data and Reveal More
Create color-coded, clustered point, and heat maps to visualize key business measures such as sales, customers, disease out breaks and concentration mapping.
SharePoint analysts typically work with large amounts of tabular data and use key performance indicators (KPIs) to identify and assess patterns and trends. ArcGIS for SharePoint can be easily integrated into an organization's larger business intelligence solution built on the SharePoint platform.